This website uses cookies so that we can provide you with the best user experience possible. Cookie information is stored in your browser and performs functions such as recognising you when you return to our website and helping our team to understand which sections of the website you find most interesting and useful.
07/11/2024
Does innovation add value?
IWSR data shows that the nature and rate of innovation – and revenue impact – varies significantly between beverage alcohol categories
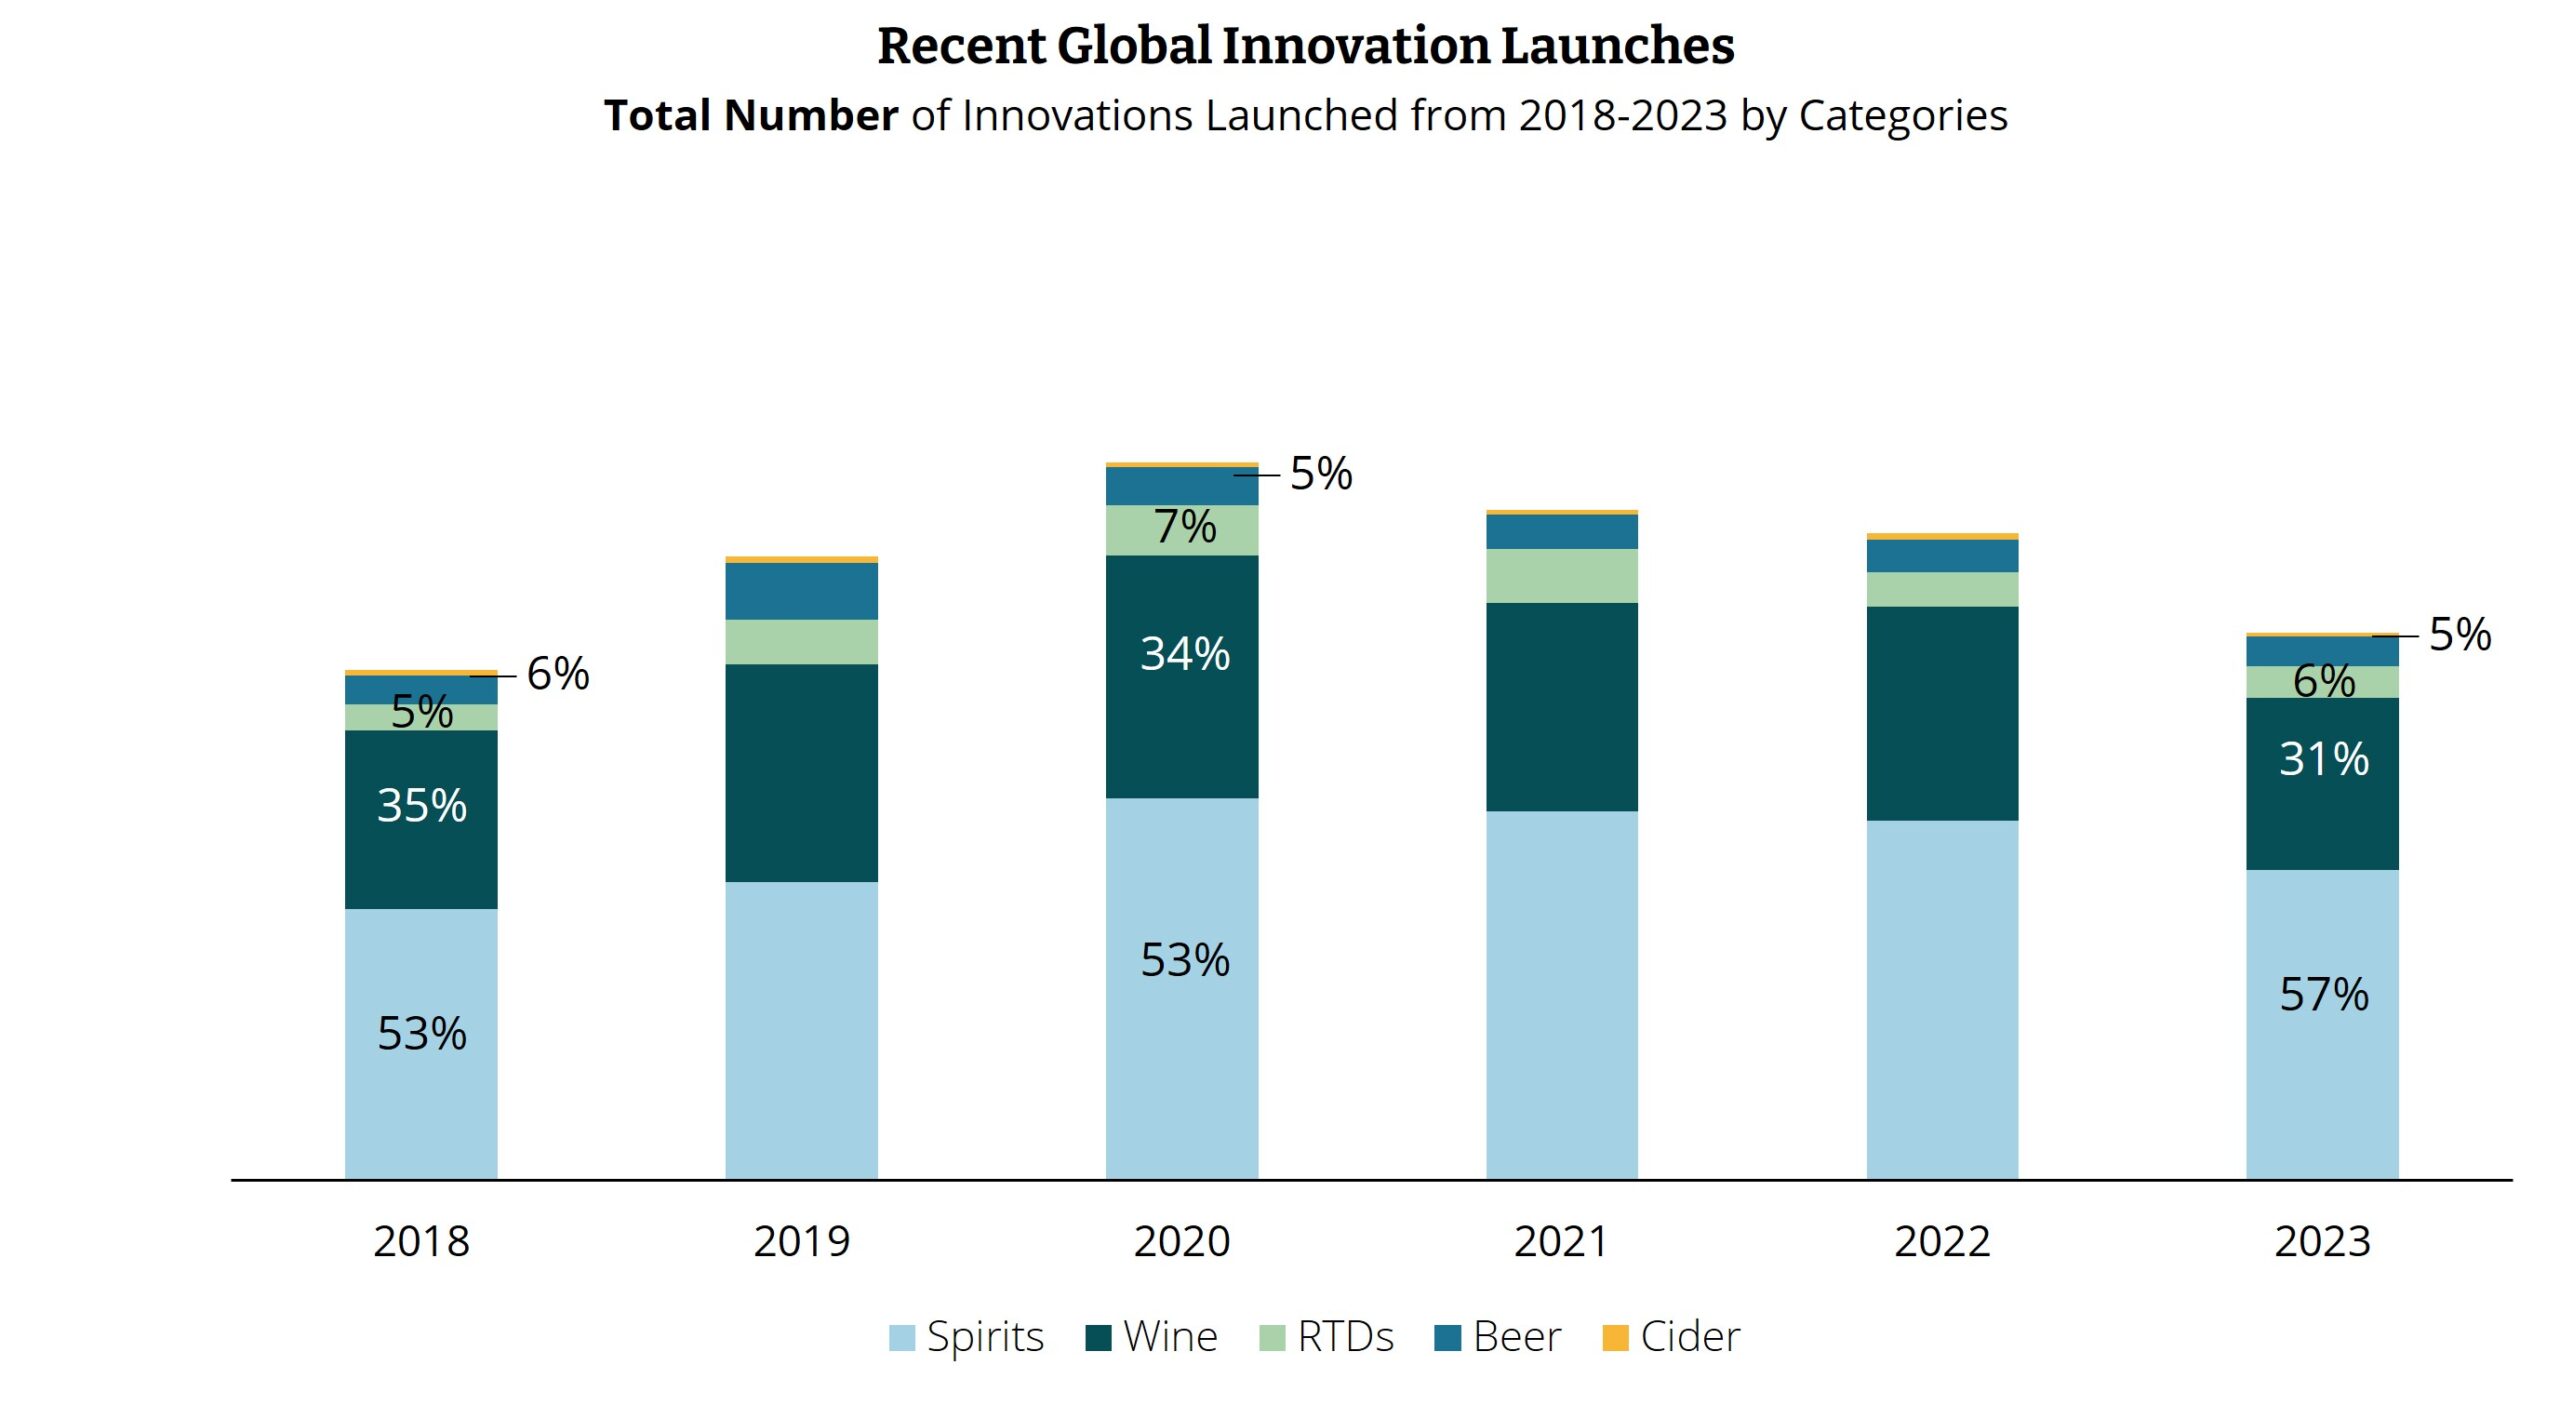
After a spike during the pandemic, the rate of innovation across beverage alcohol categories continued to trend downwards. Data from IWSR’s Innovation Tracker shows that the total number of global NPD launches fell for the third consecutive year in 2023, reaching a similar level to 2018 and a fifth down on 2020’s peak.
IWSR analysis shows that the nature and rate of innovation – and revenue impact – varies significantly between categories.
The rate of innovation across categories
Spirits – which is historically the most active category – accounted for over half of all beverage alcohol product launches in 2023. The rate of innovation in beer, meanwhile, was less than 10% that of spirits.
“Although the rate of innovation is much lower for beer, the economics of beer are very different to those of wines and spirits,” notes Luke Tegner, Director of Consulting, IWSR.
“In beer you need much larger volumes from each individual innovation in order to get a decent return. The beer industry is also more consolidated amongst a few players who tend to launch bigger, but fewer, launches.”
“Brewers are faced with higher fixed costs of brewing and distribution (such as fridge slotting fees) as well, so while beer will have fewer innovations in numbers, they need to amortise costs across much higher volumes from each launch.”
In fact, brewers generated the highest overall value from NPD when looking at the past 10-year period, doing so from a relatively small number of high-volume launches.
While the largest established categories account for the lion’s share of innovation in terms of number of launches and total revenue, the mature nature of these categories means that proportionally the initial impact of new launches here is relatively small.
In beer, for instance, innovations typically add less than 5% to total retail sales value within a year. Benefits are slower, but long-lasting, with innovations typically delivering incremental value over a long period.

Spirits drive the pace of innovation
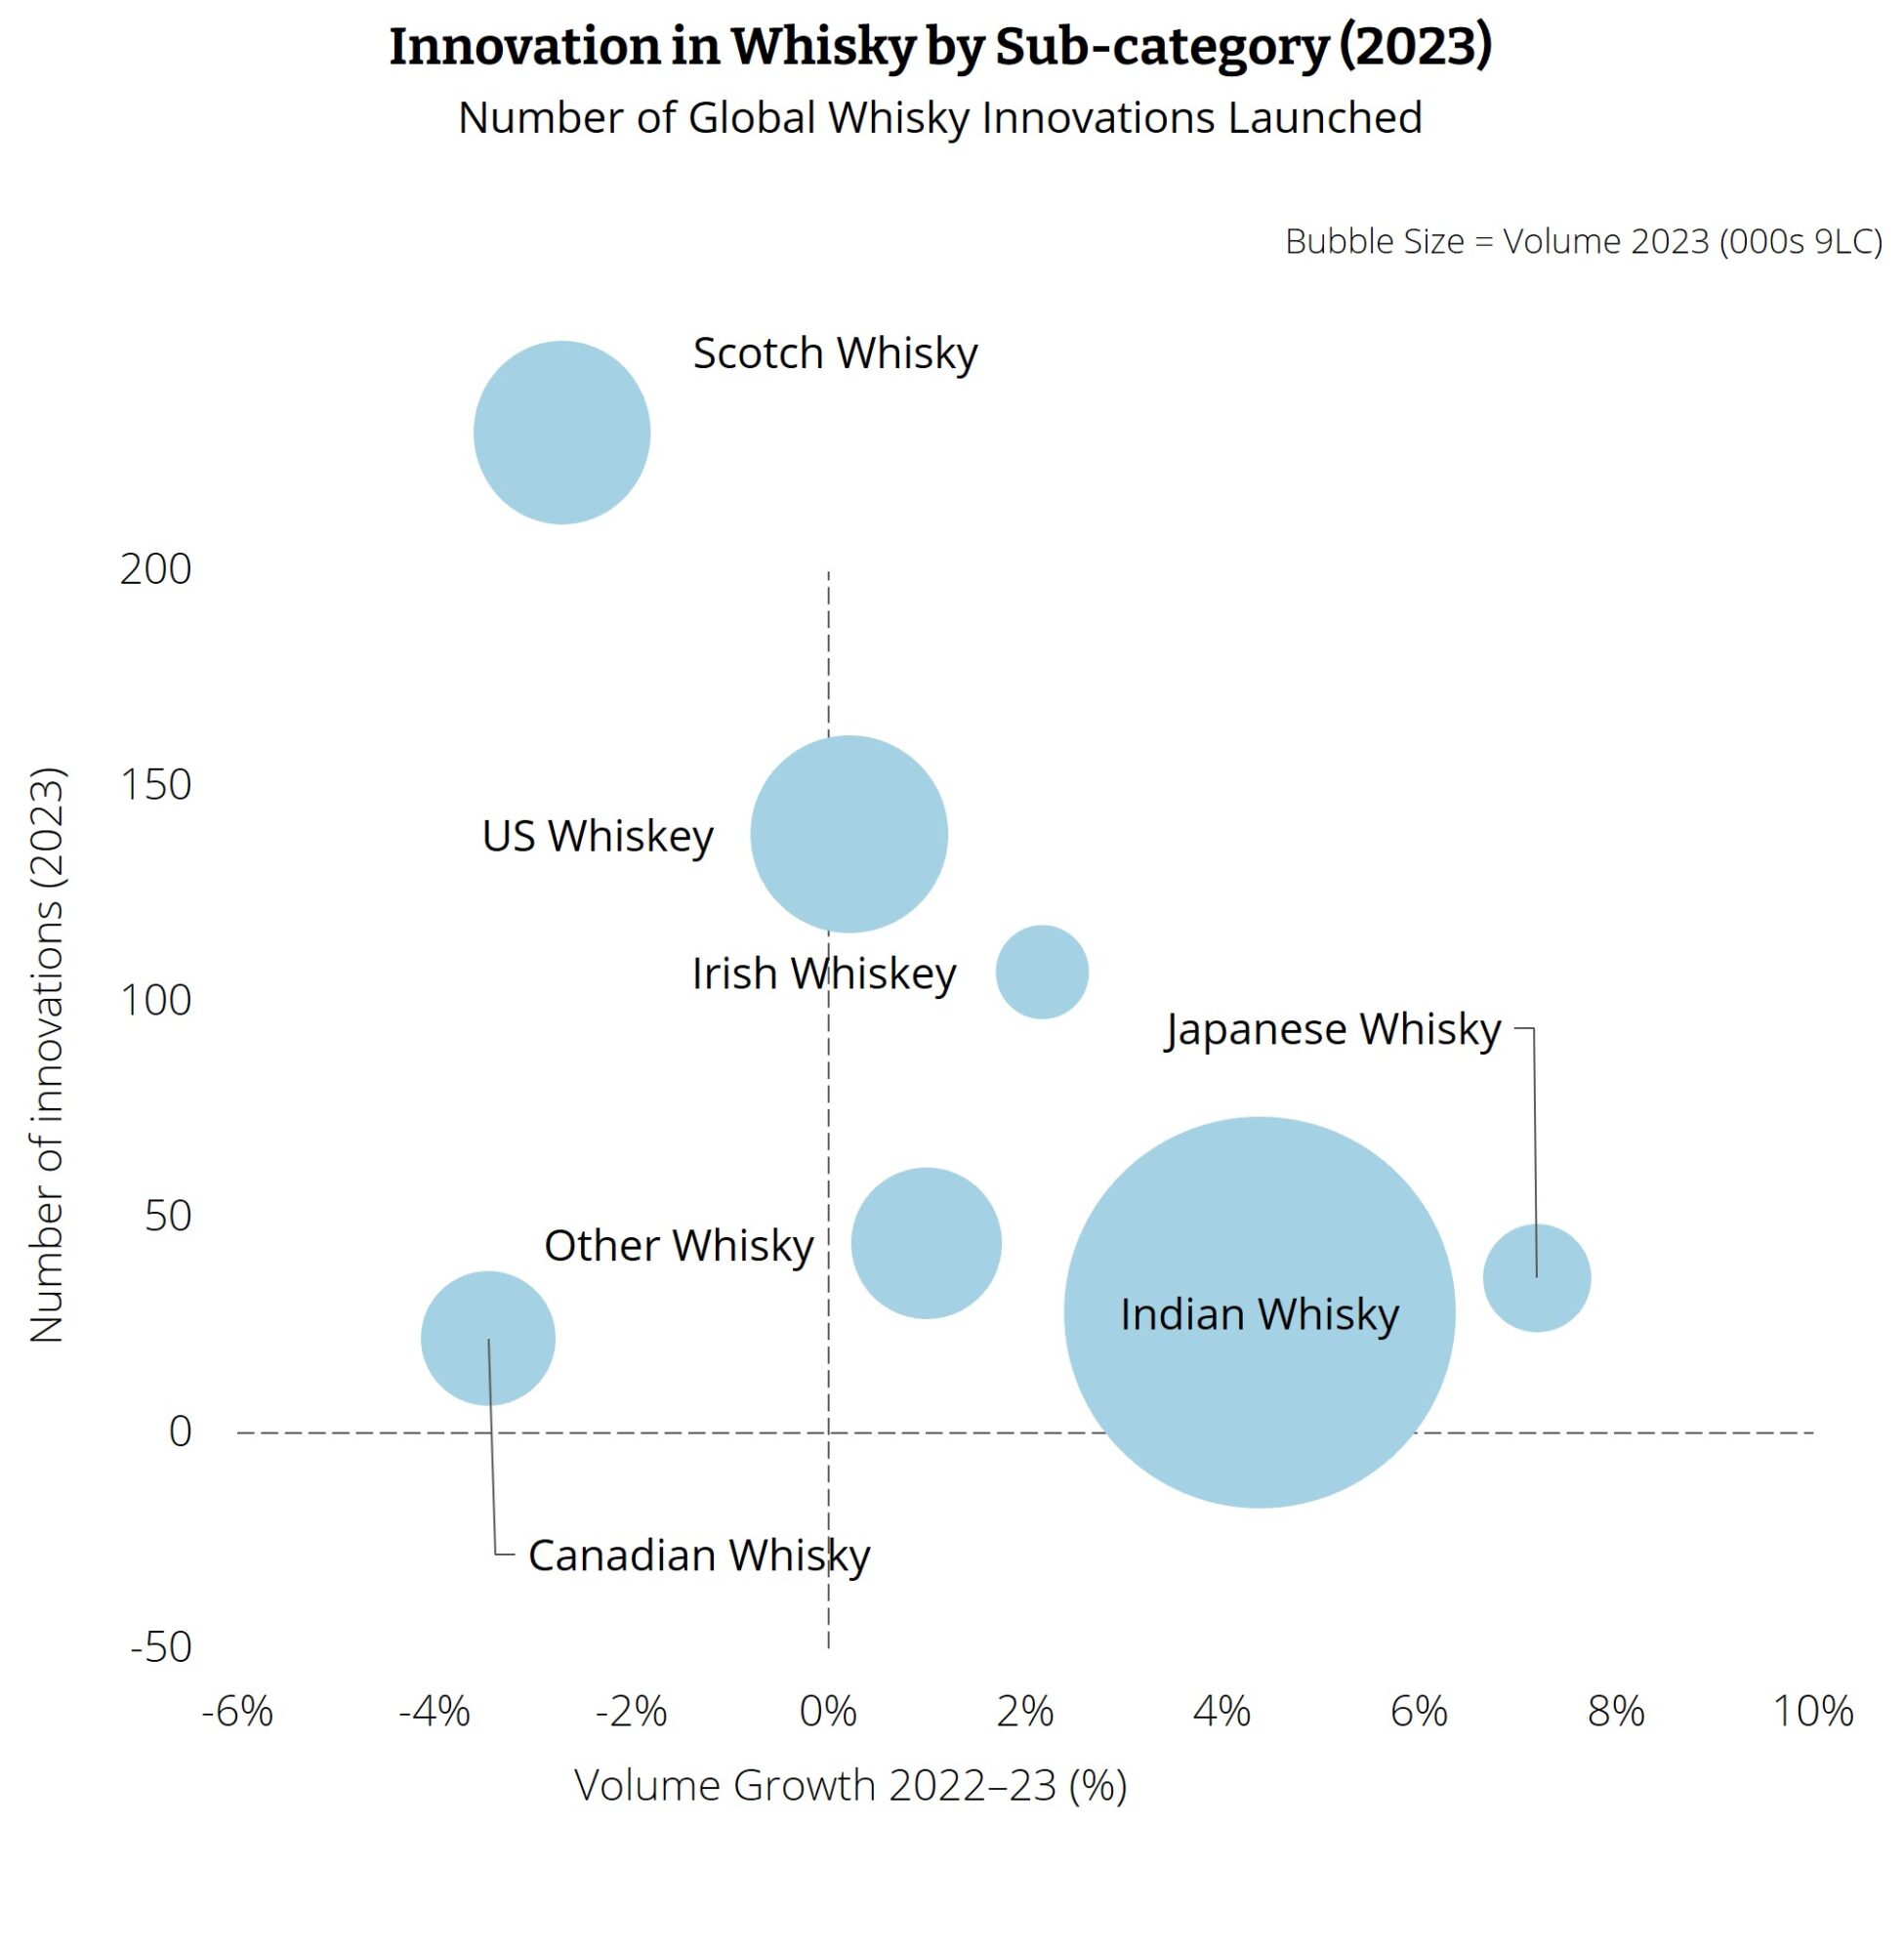
Spirits, meanwhile, have dominated the innovation landscape in terms of number of launches, led by Scotch. For the last ten years, Scotch has accounted for over half of all global whisky innovations each year, and was the most active category again in 2023, with many brands rolling out new expressions. Small volume, high value malt launches continued to target existing engaged consumers, and travel retail. US whiskey also saw significant activity, often driven by flavour innovations.

Gin, tequila and no-alcohol have a smaller absolute number of innovations than whisky, but as trending categories, innovations here have proportionally added more to these categories over the last ten years. Innovation in gin, however, has reduced as the category has become less trendy.
Tequila has seen significant flavour innovation, with new styles like cristalino and non-traditional barrel finishes such as bourbon, red wine, French oak and Japanese Mizunara driving growth.
Meanwhile, vodka brands have been active in releasing new flavour lines, but these do not always grow the wider category. New flavours replace old ones as consumers look for unique, interesting options.
Initial impact vs lifetime value
The categories where innovations have the strongest initial impact are cider and, particularly, RTDs. During the pandemic, almost 20% of the latter category’s annual value was driven by NPD launches.
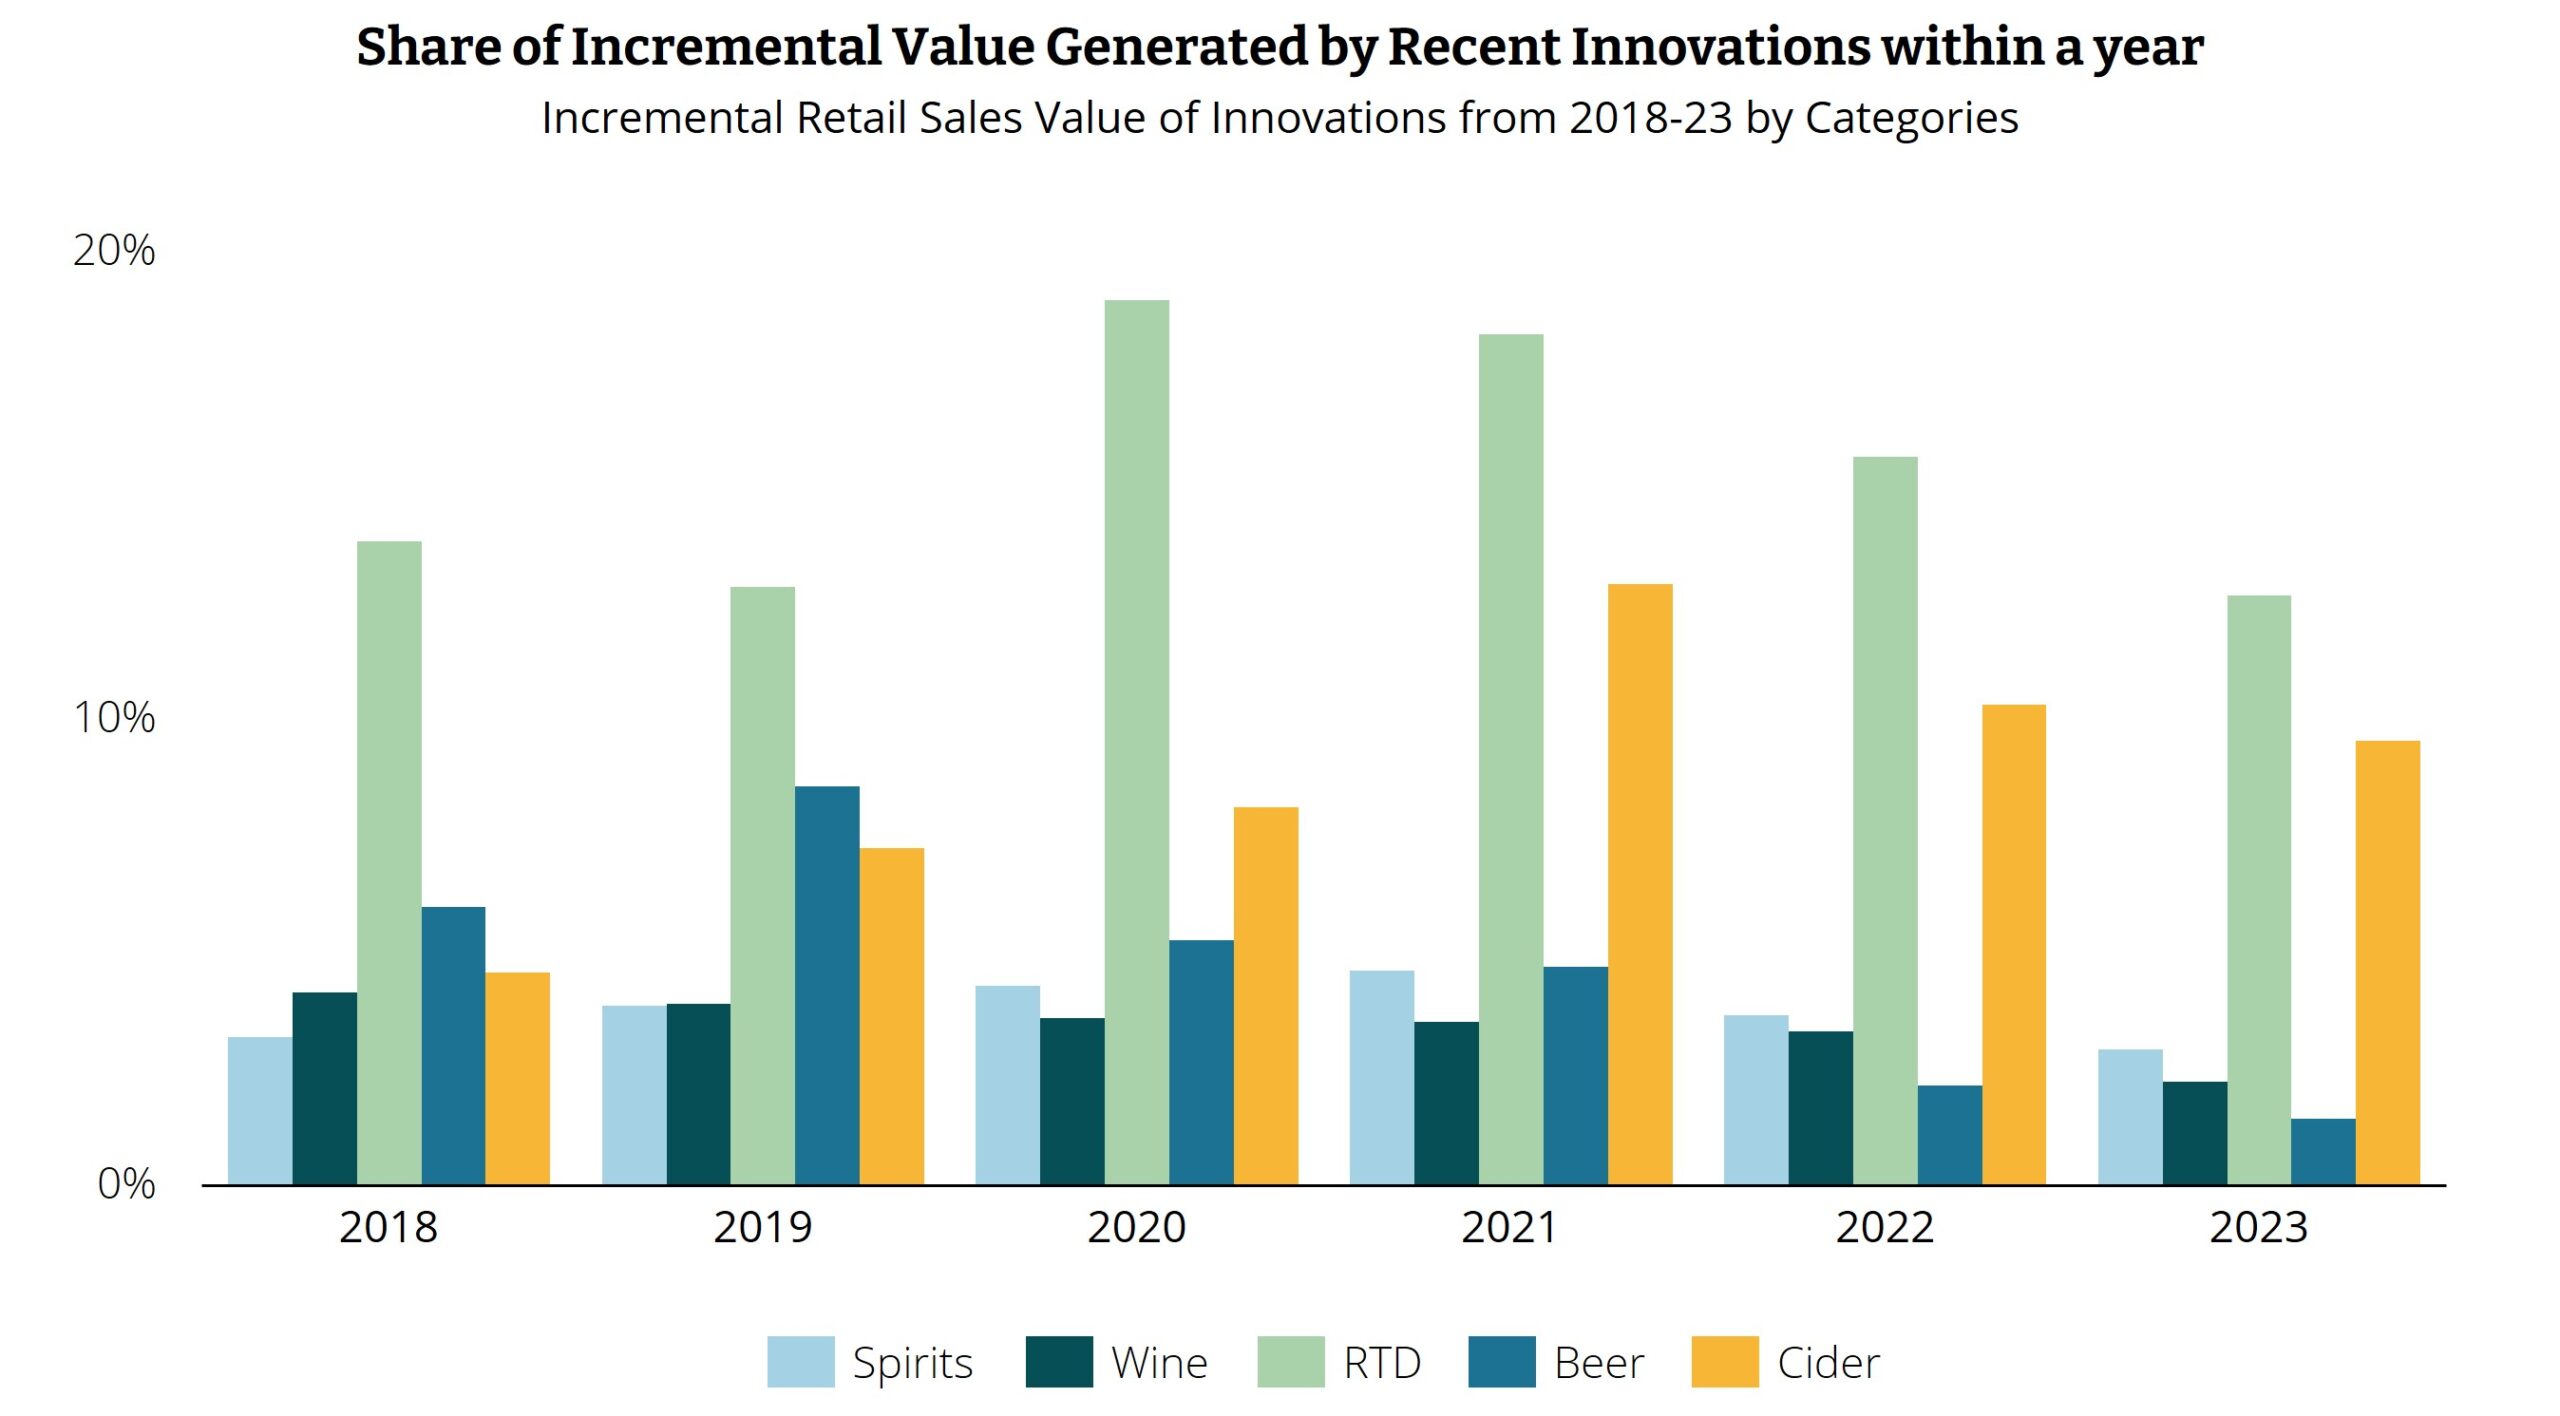

Innovations still account for a far larger share of the sales revenue in the RTD category than they do in other categories, but the drop-off in the number of launches in recent years has been significant. RTD innovations are 66% down from a category peak in 2021.
These figures suggest that consumer attitudes to launches in this category could be changing. The number of RTD brand lines available in the US, for instance, tripled between 2018 and 2022. But while RTD volumes in the US were initially positive, growing by double digits from 2018-2021, for 2022 the numbers were flat.
Some have seen parallels with the US craft beer market, which saw rapid growth driving multiple brand launches, and then – even as the number of launches continued to increase – declining sales volumes.
“Consumers like trying new products,” says Susie Goldspink, Head of RTD Insights, IWSR. “As the category initially grows and establishes itself, the more new options there are, the better. However, there comes a tipping point.”
The nature of the RTD category
It’s possible that some RTD segments have reached – or are close to reaching – this tipping point.
As well as the growing numbers of brands, the short product life cycles may also be reducing the impact of RTD launches. Individual innovations are contributing smaller initial volumes and gaining less year-on-year than in the past.
“Consumers love novelty and variety,” says Marten Lodewijks, President of the US Division at IWSR. “But exploration needs to be tempered with brand building, and if brands are constantly changing their offering, consumers won’t understand what a brand stands for.”
The saturation effect is also compounded by the current economic challenges. If cost is an issue, consumers are more likely to revert back to what they know and like, rather than risk trying something completely new.
“This is best exemplified by how some larger RTD players tend to keep hero SKUs in their portfolio so consumers have an anchor, i.e. innovation is intended to be incremental, not a substitute,” notes Lodewijks.
Consumers now almost expect RTD brands to deliver new products, so brands cannot ignore innovation outright. In Brazil, for example, a considerable lack of RTD innovation in 2021 and 2022 led to a marked slowdown of the category. Momentum picked up again when brand owners started investing in innovation in early 2023.
As such, RTD innovation strategies need to be well-thought out and positioned for local preferences.
IWSR data shows that RTD products that do well tend to be either domestic or international brands that have developed very local flavour innovations. In flavour-driven markets (such as Brazil), well-conceived new-to-world RTD brands that tap into a national taste preference can often gain share rapidly. Meanwhile, in brand-loyal markets (such as Australia or the UK) the barriers to entry are higher, and the rewards typically slower to achieve.
Planning innovation strategies
IWSR’s Consulting team advise that the business case for investing in innovation varies hugely by category, and is also a function of whether consumers and the supply chain are actually demanding innovation.
“There needs to be a desire on the part of retailers and on-trade to fill gaps in their listings, and to try new propositions. As more listings are occupied by established successful products that are making money for the supply chain, there is less demand to list new products and therefore less scope for innovations to achieve successful listings and rates of sale,” comments Tegner. “As such, brand owners need to be strategic in how and why they invest in NPD.”
IWSR analysis points to three overarching use cases for innovation, and NPD strategies should be tailored accordingly:
Case 1 is a category that needs or expects a wide variety of incremental innovation simply to drive rate of sale. Examples would be high-end whisky (such as a new cask finish) and brands working in travel retail.
Case 2 is a category where innovation is important but the barrier to entry is high and incumbents are strong (for example, RTDs and beer).
Case 3 is a category where the supply chain and buying public are very happy with the status quo and the returns on an innovation are low (such as wine)
“If our analysis tells us anything, it’s that innovation has historically been a key value driver, and while the current slowdown is likely symptomatic of brand owners responding to a cooling market, they should not step away from innovation entirely. Rather, now is the time for more targeted, considered NPD,” advises Tegner.
For access to IWSR’s Innovation Tracker data, or to understand how to tailor your NPD investment strategies to your specific business, please contact the IWSR Consulting Team at enquiries@theiwsr.com.
The above analysis reflects IWSR data from the 2024 data release. For more in-depth data and current analysis, please get in touch.
CATEGORY: All | MARKET: All |

