31/01/2022
Premiumisation and the rise of RTDs drive shifts in category share
IWSR's analysis of global beverage alcohol category share 2010-21 presents a detailed picture with subtle regional variations
This analysis is a follow-up to our previously published report “Who is really winning the category share game?”
Two years on from the onset of Covid-19, the global beverage alcohol marketplace continues to exhibit subtle regional variations, characterised by shifts across beer, spirits and RTDs.
It’s a highly detailed picture that defies easy generalisations, as the IWSR’s recent analysis of global beverage alcohol category share 2010-21 shows, with beer demonstrating good resilience in volume terms across many markets – but losing ground steadily to spirits when it comes to value. However, the scene has been disrupted by the remarkably rapid growth of RTDs since 2019, stealing share from all rival categories, but especially from beer.
Volume trends
Beer was severely impacted by the pandemic due to its relatively high on-trade exposure, but has still managed to grow volume share since 2016 in most regions. On a servings-adjusted basis, global beer volumes moved up at a CAGR of +0.2% between 2016 and 2019. However, this was mostly driven by large-scale volume declines for low-priced baijiu in China and vodka in Russia.
The same factors led to a volume decline for spirits at a CAGR of -3.1% between 2016 and 2019 – magnified by public health policies in China and Russia aimed at reducing consumption of low-end spirits. In Russia, for example, this has led many consumers to switch to lower-ABV products such as beer or wine.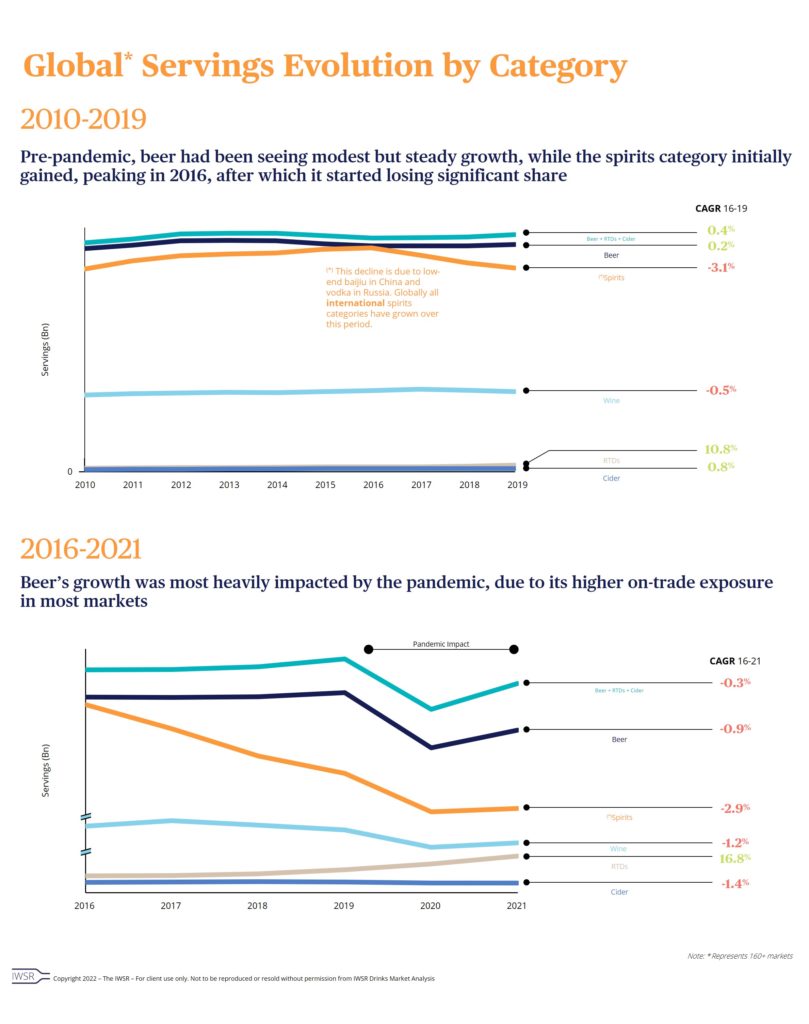
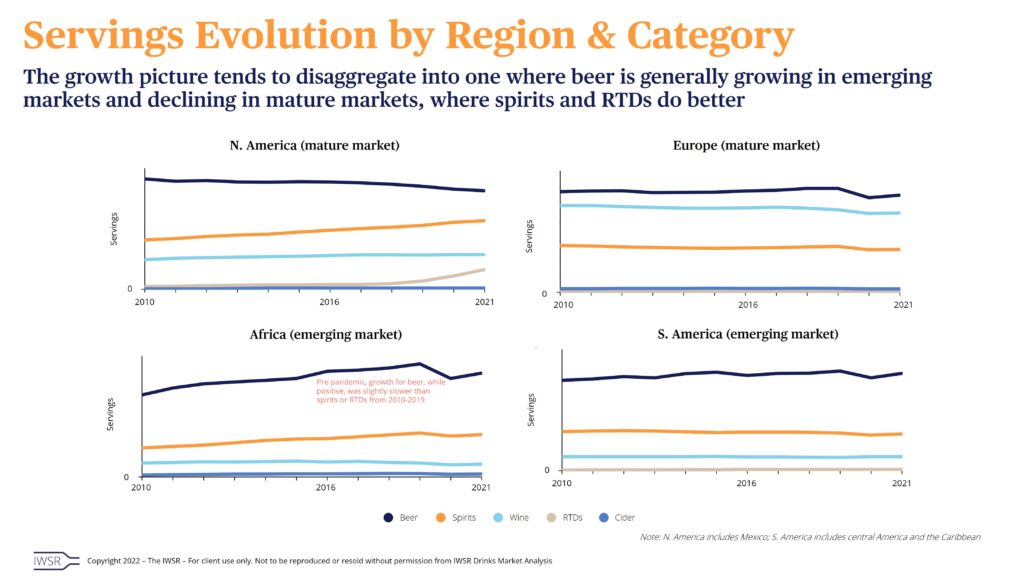
Look beyond these trends and it’s apparent that beer is tending to expand its market share in emerging markets, but is declining in mature markets, where spirits and RTDs are generally faring better.
As such, in North America, spirits volumes (on a servings-adjusted basis) rose at a CAGR of +3% between 2016 and 2021, but beer volumes fell at a CAGR of -1.7%. Meanwhile, RTDs surged forward, recording a CAGR of +33.3%.
In Europe, another mature market, the picture is more nuanced: while beer declined at a CAGR of -0.8% between 2016 and 2021, spirits fell too, by -0.6%; however, RTDs rose by +2.9%.
Figures for the emerging region of Africa are skewed by the impact of Covid-19. Pre-pandemic growth for beer, however, was positive, with a CAGR of +3.6%, but was outstripped by the performances of spirits (+4.7%) and RTDs (+7%), 2010 to 2019.
Value trends
The contrast between beer and spirits is more pronounced in value terms, with beer losing share to spirits in every region, thanks largely to premiumisation trends in spirits from 2016.
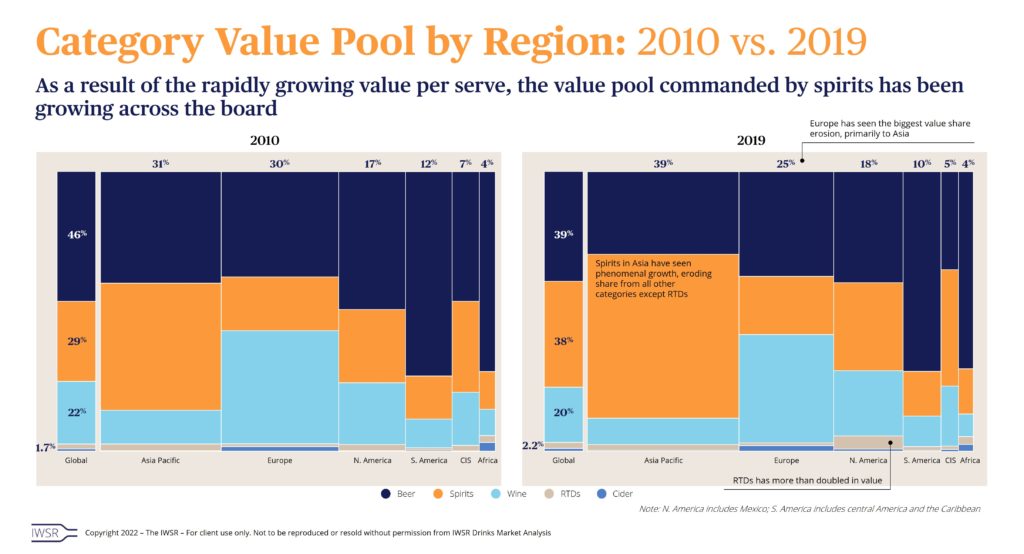
Beer’s global value share declined from 46% to 39% between 2010 and 2019, and fell further to 37% in 2021. Meanwhile, the value share of spirits has increased from 29% to 38%, and then to 40%, over the same timescale.
Here too there are local exceptions, such as beer gaining share in some emerging APAC markets, and the structural decline in low-end vodka in Russia, leading to migration into beer, wine and RTDs. Beer also staged a recovery in South America in 2021, following lockdowns and enforced on-trade closures in 2020.
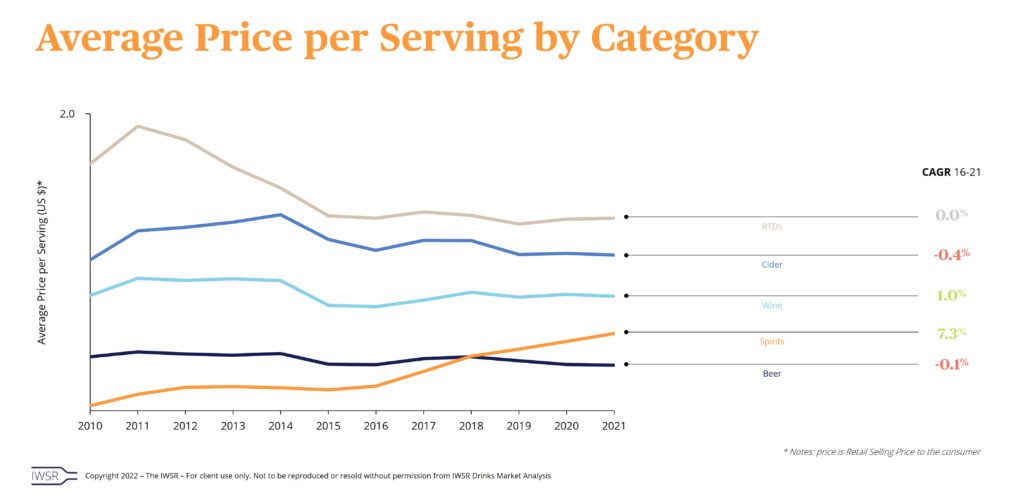
The premiumisation trend – “less but better” – for spirits is reflected in a marked increase in price per serve for spirits, particularly from 2016, at a time when beer prices remained largely flat. In terms of average price per serving, spirits moved up at a CAGR of +7.3% between 2016 and 2021. While this value surge is partly explained by volume declines in low-end spirits (baijiu, vodka), it also stems from large-scale investments from brand owners to premiumise their portfolios across mature and emerging markets.
Regional value trends
The latter phenomenon is also apparent from an analysis of category value pools by region: as value per serve has grown rapidly, the value pool commanded by spirits has expanded around the world.
This is especially evident in Asia Pacific, where remarkable growth for spirits has taken share from all other categories except RTDs and, on a regional basis, has led to an erosion of Europe’s value share of the global spirits category. While beer’s value share in APAC declined from 40% to 30% between 2010 and 2019 (and fell further to 28% in 2021), spirits increased its share from 45% to 59% – and reached 62% by the end of 2021.
Category value pool analysis also highlights the astonishingly rapid rise of RTDs, especially in North America, where RTDs more than doubled in value between 2010 and 2019, reaching a 5% value share figure in the region – and then doubled again between 2019 and 2021, reaching 11%.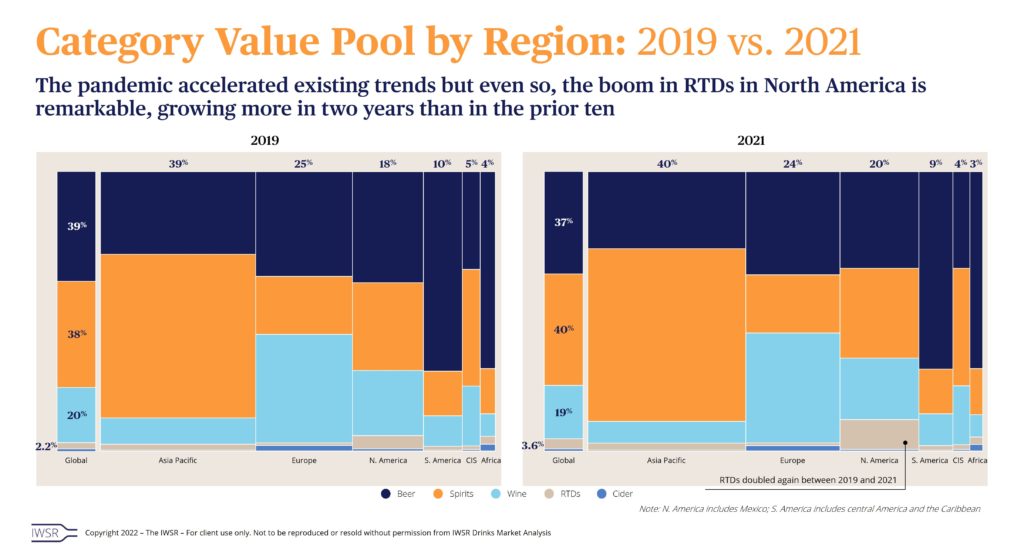
The rise and rise of RTDs
This remarkable momentum is only partly explained by Covid-19 magnifying pre-existing trends, and there are clear signs that the phenomenon is not merely confined to the US.
On a global basis, RTDs have been growing at around 10% per year (+10% CAGR for the top 20 markets, 2010 to 2021), with a rapid acceleration just before and during the pandemic virtually everywhere.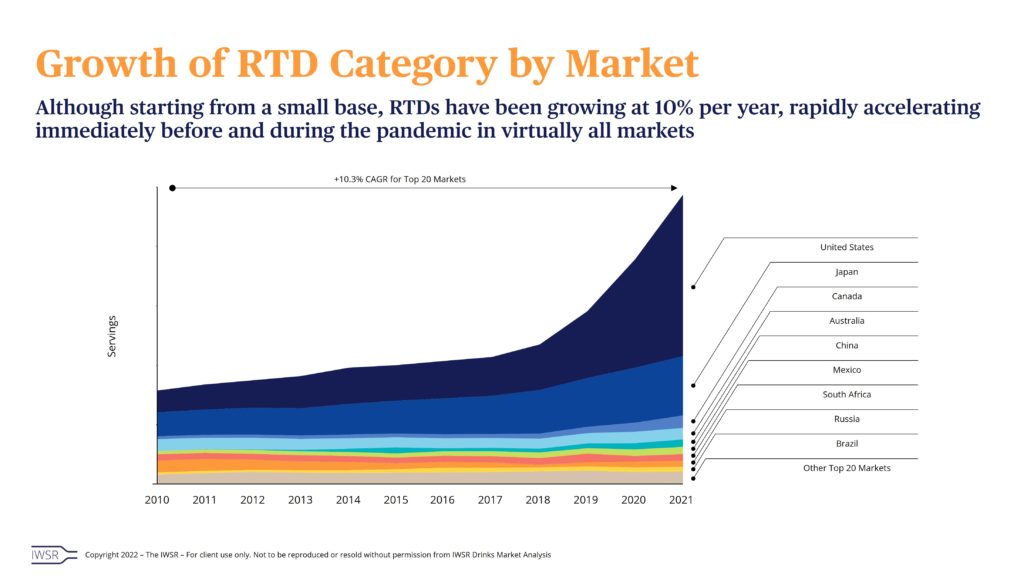
While this shift has been most evident in the US, which recorded a volume CAGR of +34% between 2016 and 2021, consumption is rising fast in a number of other countries, including Canada (+26.1% CAGR, 2016 to 2021) and Japan (+10.6%) – and the majority of the top 20 beverage alcohol markets have witnessed accelerating growth for RTDs between 2016 and 2021.
[table id=11 responsive=stack /]
You may also be interested in reading:
Drinks companies diversify as category lines blur
Key trends driving the global beverage alcohol drinks industry in 2022
Who is really winning the category share game?
The above analysis reflects IWSR data from the 2021 data release. For more in-depth data and current analysis, please get in touch.
CATEGORY: All, RTDs | MARKET: All | TREND: All, Premiumisation |
Interested?
If you’re interested in learning more about our products or solutions, feel free to contact us and a member of our team will get in touch with you.

